Usage statistics 2020
General Statistics
Number of jobs
Cluster
Number of processed jobs
Euler
| 67,670,319
Leonhard Open
| 7,702,728
Number of users*
Cluster
Number of users
Euler
| 2,663
Leonhard Open
| 794
CLC Genomics Server
| 13
Matlab Distributed Computing Server
| 129
* Only users that
submitted at least one job were counted.
Number of support requests* ,**
Support channel
Number of support requests
OTRS ticket system
| 3,682
* Tickets from the
SIS top-level and from the SIS::Leonhard Med queue are not included,
even if they were handled by the HPC group** After the
cyber attack of 15 May 2020, we temporarily stopped using the ticket
system and got around 1000 email requests between 15 May 2020 and 22
June 2020 (39 days) that were not moved to the ticket system
Euler statistics
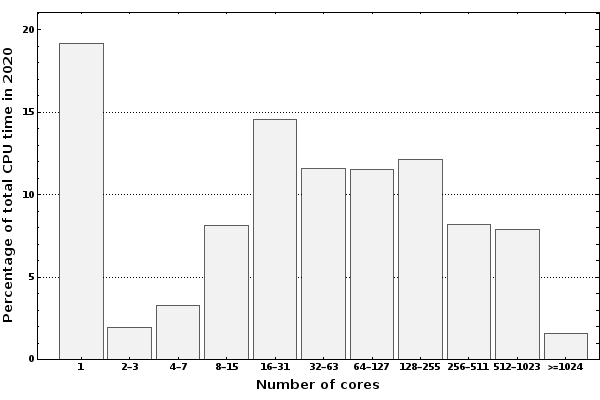
Distribution of jobs by size
Number of cores
Number of jobs
Percentage of total CPU time in 2020
1
| 57,346,732
| 19.18%
2-3
| 3,054,034
| 1.97%
4-7
| 1,788,671
| 3.30%
8-15
| 3,690,006
| 8.13%
16-31
| 1,074,259
| 14.53%
32-63
| 477,044
| 11.56%
64-127
| 127,676
| 11.50%
128-255
| 92,514
| 12.16%
256-511
| 10,129
| 8.17%
512-1,023
| 8,862
| 7.90%
>=1,024
| 392
| 1.60%
|Total
| 67,670,319
| 100.00%
Distribution of jobs by CPU time used
EulerStat2020.png
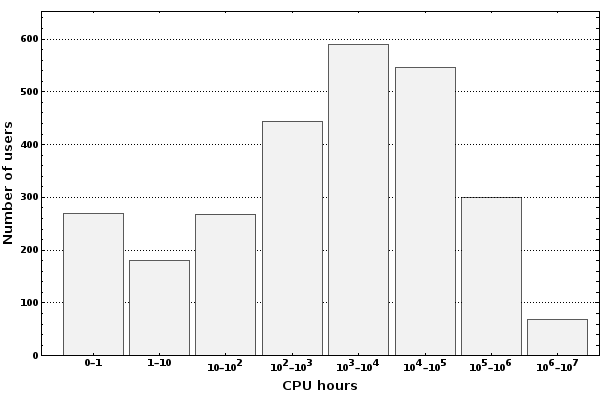
Distribution of users by CPU time used
EulerStat2020u.png
CPU hours used
Number of users
Percentage of all users
0-1
| 269
| 10.10%
1-10
| 180
| 6.76%
10-100
| 268
| 10.07%
100-1,000
| 444
| 16.67%
1,000-10,000
| 589
| 22.12%
10,000-100,000
| 546
| 20.50%
100,000-1,000,000
| 299
| 11.23%
1,000,000-10,000,000
| 68
| 2.55%
Leonhard Open statistics
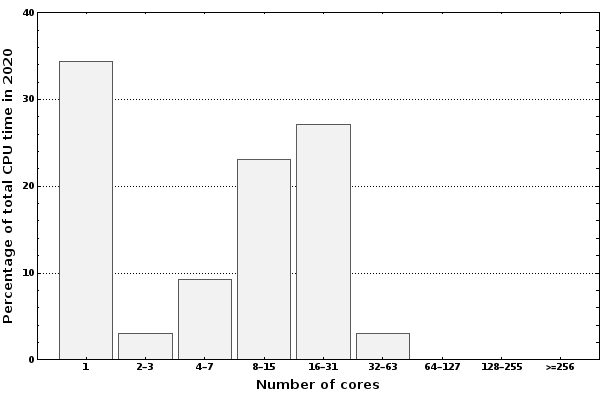
Distribution of jobs by size
Number of cores
Number of jobs
Percentage of total CPU time in 2020
1
| 6,841,515
| 34.43%
2-3
| 91,412
| 3.06%
4-7
| 203,610
| 9.26%
8-15
| 425,156
| 23.03%
16-31
| 136,476
| 27.17%
32-63
| 4,334
| 2.99%
64-127
| 213
| 0.04%
128-255
| 12
| 0.02%
>=256
| 0
| 0.00%
|Total
| 7,702,728
| 100.00%
Distribution of jobs by CPU time used
LeoOpenStat2020.png
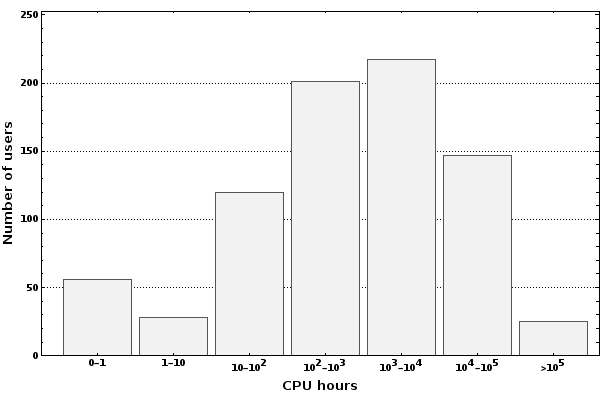
Distribution of users by CPU time used
LeoOpenStat2020u.png
CPU hours used
Number of users
Percentage of all users
0-1
| 56
| 7.05%
1-10
| 28
| 3.53%
10-100
| 120
| 15.11%
100-1,000
| 201
| 25.32%
1,000-10,000
| 217
| 27.33%
10,000-100,000
| 147
| 18.51%
>100,000
| 25
| 3.15%