Usage statistics 2024
General Statistics
Number of jobs
| Cluster |
Number of processed jobs |
| Euler |
| 41,307,926 |
Number of users*
| Cluster |
Number of users |
| Euler |
| 4,024 |
* Only users that
submitted at least one job were counted.
Number of support requests*
| Support channel |
Number of support requests |
| OTRS ticket system |
| 2,793 |
*Tickets from the
SIS top-level, the SIS::Spam and from the SIS::Leonhard Med queue are
not included, even if they were handled by the HPC group
Euler statistics
Distribution of jobs by size
| Number of cores |
Number of jobs |
Percentage of total CPU time in 2024 |
| 0* |
| 704,942 |
| 0.0% |
| 1 |
| 29,427,366 |
| 8.82% |
| 2-3 |
| 1,985,615 |
| 3.79% |
| 4-7 |
| 3,974,399 |
| 9.04% |
| 8-15 |
| 3,508,240 |
| 9.75% |
| 16-31 |
| 782,639 |
| 11.50% |
| 32-63 |
| 429,587 |
| 9.06% |
| 64-127 |
| 280,587 |
| 7.75% |
| 128-255 |
| 170,140 |
| 13.31% |
| 256-511 |
| 14,853 |
| 5.44% |
| 512-1,023 |
| 26,984 |
| 15.39% |
| >=1,024 |
| 2,574 |
| 5.97% |
| |Total |
| 41,307,926 |
| 100.00 % |
*Jobs listed with
0 cores are jobs that were submitted and then cancelled before they
started running.
Distribution of jobs by CPU time used
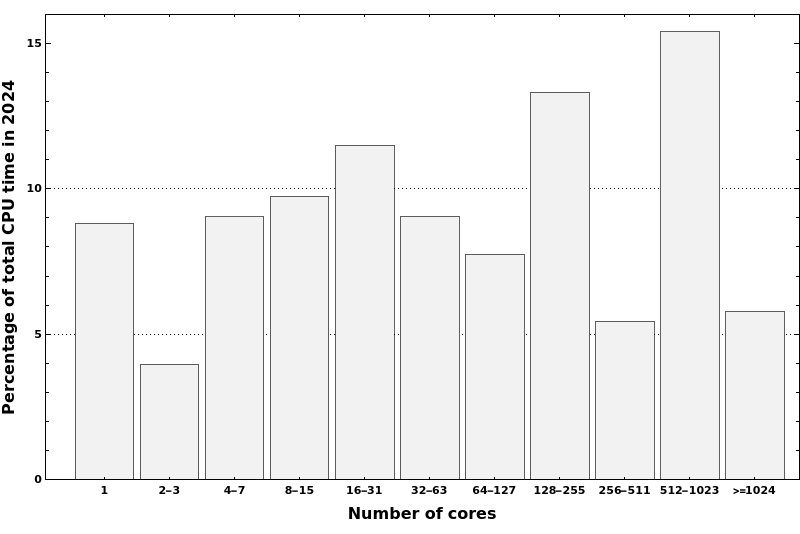 EulerStat2024.png
Distribution of users by CPU time used
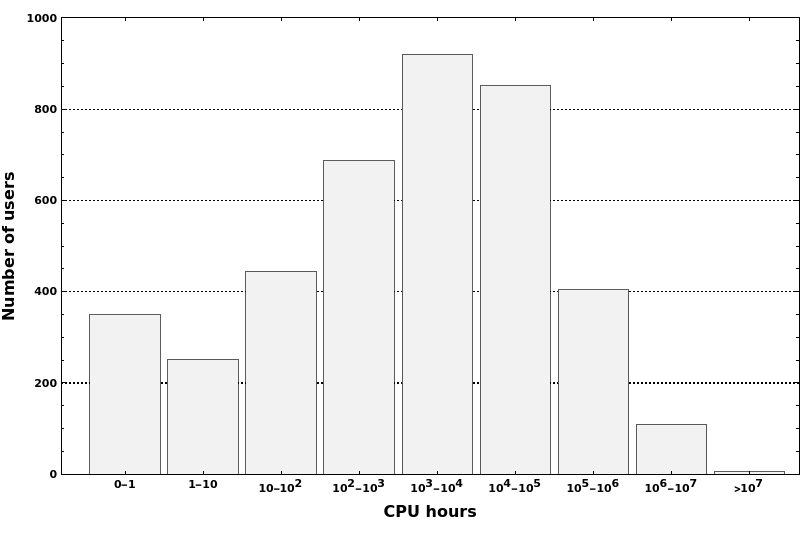 EulerStat2024u.png
| CPU hours used |
Number of users |
Percentage of all users |
| 0-1 |
| 350 |
| 8.70% |
| 1-10 |
| 252 |
| 6.26% |
| 10-100 |
| 445 |
| 11.06% |
| 100-1,000 |
| 687 |
| 17.07% |
| 1,000-10,000 |
| 920 |
| 22.86% |
| 10,000-100,000 |
| 851 |
| 21.15% |
| 100,000-1,000,000 |
| 404 |
| 10.04% |
| 1,000,000-10,000,000 |
| 110 |
| 2.73% |
| >10,000,000 |
| 5 |
| 0.13% |
| |Total |
| 4,024 |
| 100.00% |